Stocks candlestick patterns are a brilliant way for traders to understand short-term movements seen across the market.
They are very useful in shedding light on supply and demand dynamics and are thus used to understand price shifts of stocks, along with other securities being traded.
For those engaged in day trading in the stock markets, candlesticks for stocks are essentially a mainstream way of tracking price movements.
It conveys a lot more information than a typical line graph does and hence is a highly valuable tool.
By understanding how these patterns work, along with the information they deliver, market participants stand better equipped to make informed trading decisions, while maximizing their gains, and reducing exposure to losses.
In this article, we go over everything you need to know about stocks candlestick patterns, and how best to use them to your advantage in the stock market.
What are Candlestick Stocks?
Candlestick stocks are essentially a graphical way to represent the price movement of stocks, over a specific period of time.
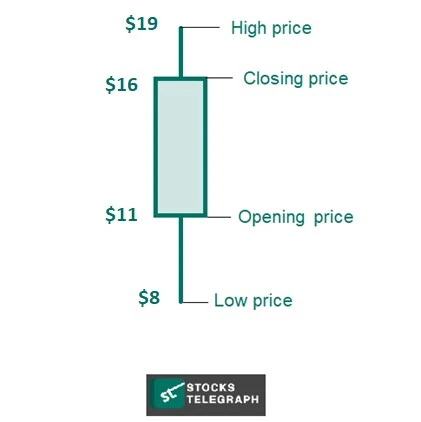
A single “candlestick” is represented by a bar that conveys useful information such as opening price, closing price, and highest and lowest price points.

In the example above, we see how the price movement of a stock is represented by a candlestick for a specific period of time (such as an hour, or a day).
It tells us the range of movement the price had seen, as well as its shift from opening to close.
Four Types of Candlestick Patterns
When candlesticks are graphed together as a series over time, they form stock candlestick patterns, the interpretation of which can significantly aid traders in their decisions. ‘
Listed below are the four broad categories of candlestick patterns:
-
Single Candlestick Patterns
These refer to when analysts derive conclusions from a single candlestick seen on a chart, which points out present trends and market sentiment, during a specific time period.
Examples include the Doji, hammer, and shooting star.
-
Continuation Candlestick Patterns
During certain instances, candlesticks stocks may point to a consistent continuation of a particular pattern.
Traders use these to identify buying and selling opportunities with the conviction that the pattern will continue on this consistent path.
-
Reversal Candlestick Patterns
When traders observe reversal candlestick patterns, they are an indication of an imminent turnaround, causing bears and bulls to shift their positions.
These are primarily used to strategically time one’s entry or exit position on a particular stock.
-
Complex Candlestick Patterns
Moving beyond the straightforward patterns, market participants also interpret signals from complex candlestick patterns.
These typically combine continuation trends with reversal patterns in a variety of sequences.
-
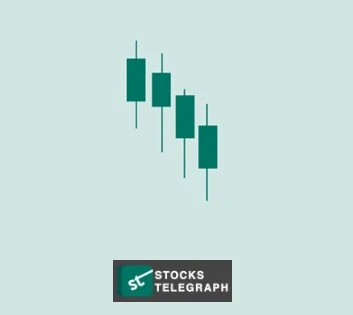
Three Black Crows
This particular pattern comprises three consecutive bearish candles that open in close proximity to the previous close and progressively close at lower levels with each candle.
It suggests a shift from an uptrend to a downtrend, hinting at possible further price declines.
-
Evening Star
The evening star candlestick pattern signifies a potential reversal from an uptrend to a downtrend.
It features three candles: a large bullish candle, a small-bodied or doji candle, and a bearish candle.
The evening star warns traders of a possible trend reversal and encourages caution.
-
Shooting Star
In the trading world, a shooting star candlestick has a long upper shadow and a small real body near the low of the candle.
It appears after an uptrend and suggests a potential reversal, indicating that buyers may be losing control and bears could take charge.
-
Hanging Man
In candlestick chart analysis, the hanging man pattern occurs after an uptrend and looks like a small-bodied candle with a long lower shadow.
The hanging man raises concerns about a potential trend reversal and indicates that sellers might be gaining strength, posing a risk to the previous uptrend.
Four Continuation Candlestick Patterns
In our journey to understand stock candlestick patterns, let’s now dive into four crucial continuation patterns.
These patterns act as guides, helping us make informed trading decisions based on ongoing market trends.
-
Doji
This is a candlestick with a tiny or no body, but long upper and lower wicks.
It suggests a temporary stalemate between buyers and sellers, indicating a potential continuation of the current trend.
Just remember to look for confirmation from the next candlestick before making your move.
-
Spinning Top
Imagine a spinning top toy, wobbling back and forth, uncertain about its next move. Well, the Spinning Top candlestick pattern mirrors that same indecision in the market.
It appears as a small-bodied candlestick with upper and lower shadows.
This pattern tells us that buyers and sellers are in a bit of a tug-of-war, creating a pause in the trend.
Keep an eye out for confirmation from subsequent candles to get a better sense of where things are headed.
-
Falling Three Methods
When it comes to a downtrend, the Falling Three Methods pattern is very interesting.
It starts with a long bearish candle, followed by a series of smaller bullish candles that stay within the range of the first candle.
This pattern signals a temporary consolidation before the downtrend potentially resumes.
It’s like a minor stop on the journey downward, giving you an opportunity to plan your next move accordingly.
-
Rising Three Methods
On the flip side, we have the Rising Three Methods pattern, a ray of hope within an uptrend.
This features a long bullish candle followed by a sequence of smaller bearish candles, all trading within the range of that first candle.
The pattern suggests a temporary consolidation before the uptrend potentially kicks back into gear.
It’s like a breather for the stock, allowing you to prepare for the continuation of the upward movement.
Difference Between Foreign Exchange (FX) Candles and Other Markets’ Candles
It’s important to note that not all candlestick charts are created equal.
In this section, we’ll explore the key differences between Foreign Exchange (FX) candles and candles from other markets.
Understanding these distinctions will help you make more informed trading decisions and navigate the dynamic world of forex trading.
-
Timeframe Variations
Unlike other markets, forex candles can represent various timeframes, from minutes to hours.
This flexibility allows forex traders to analyze price patterns at different intervals, regardless of fair market value, adapting to their trading strategies and capturing opportunities in the dynamic forex market.
-
Market Liquidity and Volume
Forex is the largest financial market globally, with high liquidity and unusual volume levels.
This means that forex candlestick patterns reflect the collective actions of numerous market participants, making them more reliable and less susceptible to manipulation compared to smaller markets.
-
Impact of Economic News
Forex markets are heavily influenced by economic news releases, central bank announcements, and geopolitical events.
These factors can lead to sudden price movements and volatility, resulting in more dramatic shifts in FX candlestick patterns compared to other markets.
Staying updated on economic events is crucial for informed forex trading decisions.
-
Currency Pair Specifics
Forex trading involves currency pairs, each with its own unique characteristics influenced by interest rate differentials, economic performance, and political stability.
Understanding these specifics is essential in interpreting candlestick patterns accurately and making informed trading decisions tailored to the dynamics of the currency pair you are trading.
Understanding Candlestick Analysis of Stock
Using the stocks candlestick patterns analysis technique is highly crucial in guiding one’s trading decisions, as it opens up the market player to a range of opportunities that otherwise could not have been determined through other indicators, and helps predict future price paths.
Listed below are some of the main candlestick patterns that traders strive to identify when carrying out a candlestick analysis of stock:
-
-
Bearish Patterns
When traders identify bearish patterns, they typically determine pessimistic sentiment permeating across the market.
This can thus be used to adjust trading strategies to match the wider mood of the market. The dark color to fill in the candle reflects a loss in terms of the closing price.

-
Bullish Patterns
Bullish patterns are important in day-to-day trade and analysis, as they indicate that the market is gearing up to enter into a buying frenzy.
These stocks candlestick patterns direct traders to start loading up on cheap stocks and take part in the exciting growth rocket approaching. The light color to fill in the candle reflects a gain in terms of the closing price.

-
Bullish Hammer
The bullish hammer is a candlestick with a small body and a large wick beneath it.
It suggests that the buyers overpowered the sellers throughout the specified time period, and drastically stepped up to drive prices upward, closing on a high note.

-
Inverted Hammer
An inverted hammer is a pattern that causes traders to enter a more cautious mode of trading.
Its small body and higher upper wick show the reversal of an upward trend, due to sellers rushing a stock that bulls have been fighting to drive up.

-
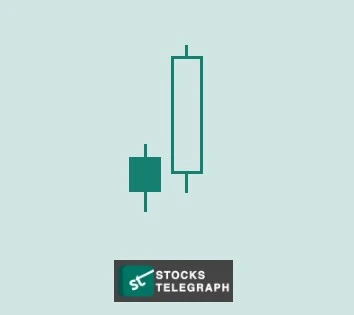
Engulfing Line
The engulfing line pattern is of utmost importance to traders, as it signals the end of a particular trend and the emergence of a new one.
It is represented by a small candlestick, which is either bullish or bearish and is followed by a much larger bar of the opposite nature.

-
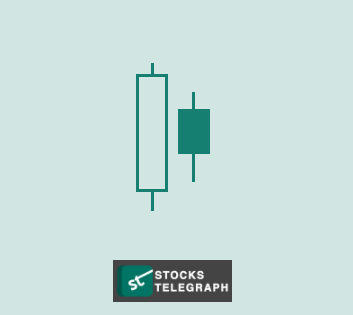
Harami
The Harami pattern is another candlestick trend that indicates the arrival of a reversing trend.
It is denoted by a candlestick, followed by another one, whose body fits entirely within the trading price range of the previous one. It points to advantageous entry and exit points.

-
Piercing Line
The piercing line trend is an example of a complex candlestick pattern.
It comes about when, after a small bearish candle, a long bullish one opens beneath the low of the previous one, yet still closes above its mid-point. This typically suggests a trend reversal.

-
Interpreting a Candle on a Candlestick Chart
Because candlestick charts simplify complex information into graphical information that is easy to interpret, they are the favored method by which traders pick stocks with visualized price movements in the stock markets.
They are used to interpret both single-candle formations and multiple price patterns:
-
Interpretation of single-candle formations
Just as broad stock candlestick patterns tell market participants a lot about market sentiment and demand/supply dynamics, single-candle formations too are insightful.
Even though they do not take into account a broader range of time, they signal crucial turning points that could potentially guide traders.
When assessing single-candle formations, traders are especially interested in the size of the candle’s body, the length of its wicks, and the color of the chart.
All this information reveals signs of possible entry and exit points to stocks being monitored over a range of time.
It is important to note that traders must be wary of false signals with single candle charts. This is due to the limited, and de-contextualized information they present.
It is always best for traders to tie in their candlestick analysis of the stock to a broader range of data, beyond single candles.
-
Recognizing Price Patterns in Multiple Candles
The interpretation of price movements through patterns of multiple candles is generally more insightful than relying upon individual candles.
This is because this points to wider trends over a range of time, rather than price behavior in a single time frame.
It is only through multi-stick candle formations that traders are able to step back and assess reversal trends and continuation patterns that can allow them to act with more certainty.
Due to this, multi-stick candle patterns offer a broader view of price movement.
Because of the contextual aspect of multi-candlestick patterns, and the stronger signals they provide, they are preferred over single-candle formations.
They are able to point out the relationship and interaction between multiple individual candles on the chart.
Does Candlestick Pattern Analysis Really Work?
Now that you know quite a bit about stocks candlestick pattern analysis, you may be wondering if it truly holds value in making informed trading decisions. Well, let’s shed some light on this.
Candlestick patterns have been around for ages, and traders have been using them to gain insights into market behavior.
They can be pretty handy in identifying potential trend reversals or continuations, with the useful tips they shed light on. But here’s the thing: they’re not foolproof crystal balls that predict the future.
Here’s the deal: while stocks candlestick patterns can be helpful, they shouldn’t be the sole basis for your trading decisions. Think of them as puzzle pieces in a much larger picture.
To make informed choices, it’s essential to combine candlestick patterns with other tools like technical indicators, fundamental analysis, and risk management strategies.
Remember, the market is a complex creature influenced by a bunch of factors like news events, global happenings, and human emotions.
stocks candlestick patterns can’t capture the full complexity of these elements on their own. So, it’s crucial to consider the broader context and use a well-rounded approach to trading.
Also, keep in mind that the effectiveness of candlestick patterns can vary depending on the market conditions and the timeframe you’re looking at. You need to adapt.
So, take your time to study different patterns, their subtleties, and how they play along with other indicators.
Ultimately, practice makes perfect. So educate yourself on candlestick patterns, dig into historical charts, and see how those patterns behaved in the past.
By doing this, you’ll develop an eagle eye for spotting patterns and understanding their potential impact.
Which Candlestick Pattern Is Most Reliable?
When it comes to stocks candlestick patterns, one stands out as a reliable indicator of potential bullish trends: the Bullish Engulfing pattern.
It offers valuable insights into market sentiment, presenting opportunities for informed trading decisions.
The Bullish Engulfing pattern occurs when a larger bullish candle completely engulfs the previous smaller bearish candle.
It represents a shift from bearish to bullish sentiment, making it a compelling signal for potential upward momentum.
The Bullish Engulfing pattern is reliable due to its ability to capture significant market reversals.
It suggests that buyers have overcome initial selling pressure, indicating a potential trend reversal or continuation of an existing uptrend.
The complete engulfing of the previous candle’s body further strengthens the bullish momentum.
To make the most of this pattern, consider supporting factors like positive fundamental news, strong technical indicators, or a break of key resistance levels.
When these align with a Bullish Engulfing pattern, it becomes a robust signal for considering long positions.
Conclusion
Stocks candlestick patterns are a popular way that market traders visually track the movement of stocks.
As tools to guide investment decisions, they are quite powerful in the sense that they help identify crucial trends such as those that indicate continuations or reversals.
By understanding each of the types of candlestick patterns and what they imply, traders stand at a significant advantage and are able to strategically time their entry and exit points that relate to the stocks on their radar.
They are thus vital parts of the trader’s technical toolkit to make money in the market.
It is important to note that, in order to develop a sound trading strategy, candlestick charts represent a single core dimension to consider.
For a holistic approach, other tools must also be employed that give a wider look, while considering the fundamentals of the company.
FAQs
Which Is the Best Type of Candlestick Chart To Use?
The best type of candlestick chart to look for would ultimately depend on the trading strategy of the particular trader and the prevalent market sentiment.
For example, a bullish reversal would be the best trend to hop on for anyone looking to initiate a long position on a specific stock.
What Exactly Should I Focus on When Studying Candlestick Patterns?
When studying stocks candlestick patterns, there are four important aspects to pay attention to.
These are the shape of the body, the size of the wicks, the color of the candle, along with the position in a broader candle pattern.
What Are Some Common Mistakes to Avoid When Using Candlestick Patterns?
The most common mistakes to avoid regarding candlestick patterns are overanalyzing minor patterns, ignoring the broader context, and following an impulsive rather than disciplined trading approach. All these mistakes are critical pitfalls that can result in a disaster.


