In the world of trading, successful traders rely on a combination of experience, skill, and discipline to generate profits. One of the most essential tools in their arsenal is the use of stock patterns. These patterns are formed by the price movements of a stock over time and can provide valuable insights into future price movements. There are countless stock patterns that traders use in their strategies, ranging from simple formations like support and resistance levels to more complex charts like the head and shoulders pattern.
The head and shoulders price pattern is one that has stood the test of time and continues to stand tall among mainstream pricing patterns.
Whether you are a novice trader or a seasoned investor, the head and shoulders pattern is a valuable tool that can help you navigate the complex and ever-changing world of the stock market
What Is The Head And Shoulders Pattern?
The head and shoulders pattern is a common chart pattern that many use to confirm a trend reversal. As opposed to fundamental investing, the pattern is a major part of the technical day-trading analysis.
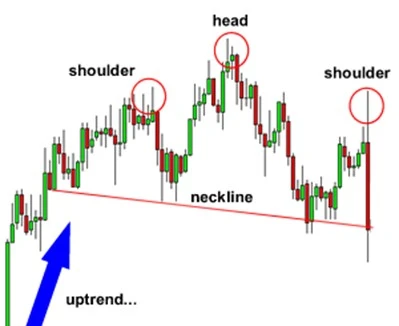
Its name comes from the fact that its three peaks resemble two shoulders and one head, as portrayed in the image below:

As can be seen, the peak of the left shoulder points to rallying bulls and strong buying behavior which drives up stock prices. This is then followed by a pullback, taking the price down to the neckline, which once again is driven to a new high, at the head level.
Once at the head level, which represents the maximum point in the entire formation, the price once again falls to the neckline and is then followed by a brief climb to the right shoulder. Eventually, it falls back down to the neckline, on the extreme right of the pattern.
The neckline is a critical part of the pattern, as it reflects the support level. After falling below this point, a downward plummet is inevitable and the trend reversal is underway. This strongly marks an exit point for keen observers.
What Is An Inverse Head And Shoulders Pattern?
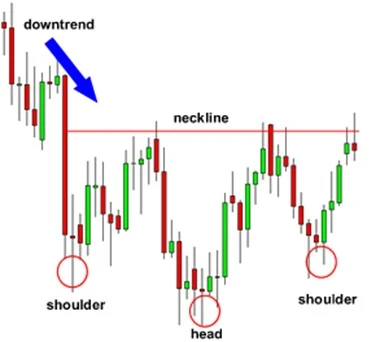
As the name suggests, the inverse head and shoulders pattern is simply the head and shoulders price pattern described above, but inverted vertically such that the three peaks are actually three troughs.

Where the head and shoulders are a clear signal of an upward trend undergoing reversal, the inverse of it points to a reversal of a downward trend. It thus signals an entry point for market bulls looking to enjoy an epic price climb.
The inverse head and shoulders pattern is significant because it suggests a shift in market sentiment from bearish to bullish. The inverted left shoulder represents a strong selling period whereas the inverted head point to an even stronger selling trend.
By the time the chart from the inverted right shoulder, there is an indication that sellers are clearly losing interest, and that a bullish takeover is imminent.
The inverse head and shoulders pattern is simply the flip side of the head and shoulders coin, with both patterns going hand in hand, informing traders of trend reversals and sentiment shifts based on their behavior.
What Does A Head And Shoulders Pattern Tell You?
As pointed out above, the head and shoulders trading pattern is incredibly useful to traders, as it guides them toward identifying exit points before the stock actually undertakes a hard plunge.
In particular, there is a range of information that a head and shoulders chart conveys to those that are successful in identifying it. The most important of these are:
-
Possible Trend Reversal
When a head and shoulders formation is observed, the most obvious indication is an imminent trend reversal from bullish to bearish. The pattern points to buyers gradually losing interest, paving the way for a selloff to ensue.
-
Resistance Levels
Another piece of insight that head and shoulders charts shed light on is resistance levels. In particular, the neckline in the pattern is extremely useful to traders in determining when shifting in sentiment.
Many use the resistance indicator from the head and shoulders chart to set target prices in a fairly accurate manner.
-
Volume Trends
Ultimately, those well-versed in the technical analysis of head and shoulders charts are able to accurately assess buying and selling pressure.
Typically, the volume will be higher during the formation of the left shoulder, the head, and the right shoulder. However, the volume will usually decrease as the pattern approaches the neckline.
5 Advantages Of The Head And Shoulders Pattern
The head and shoulders trading pattern is a highly useful tool for traders in the market, offering them a wide range of benefits. Five of these are discussed below:
-
Reliability
The pattern has a high degree of accuracy in predicting trend reversals, making it a reliable indicator.
-
Straightforward Signals
The pattern is easy to identify on a price chart, providing a clear and straightforward signal for traders.
-
Target Price
The pattern provides traders with a clear target price for the trend reversal.
-
Versatility
The pattern can be applied to a wide range of markets and timeframes, making it a versatile tool for traders.
-
Risk Management
The pattern provides traders with a clear level of support (the neckline) to manage risk.
5 Disadvantages Of The Head And Shoulders Pattern
Going on about the advantages of the head and shoulders pattern, without mentioning its inherent disadvantages would not contribute towards a holistic view of the tool. Listed below are five weaknesses associated with the tool:
-
False Signals
While the pattern has a high degree of accuracy, there can still be false signals that can lead to losses if traders act on them.
-
Subjectivity
There can be some subjectivity in identifying the pattern, as different traders may draw the neckline or the shoulders differently, leading to differing interpretations.
-
Time-Consuming
Identifying and analyzing the pattern can be time-consuming, especially for new traders who may not be familiar with it.
-
Limited Applicability
The pattern may not work well in all market conditions, such as during periods of high volatility or low trading volume.
-
Late Confirmation
The pattern may confirm the trend reversal after the price has already moved significantly, resulting in missed trading opportunities or reduced profits.
How Reliable Is A Head and Shoulders Pattern?
The head and shoulders price chart is renowned for its reliability. There has been comprehensive research rigorously conducted on the predictive power of the tool. It has been found to be a remarkably solid and dependable approach to identifying trend reversals.
One primary reason why the technical analysis of the head and shoulders chart is so reliable is its inherent simplicity, which erases the margin of error. Unlike complex patterns, it gives a straightforward outlook and a clear signal.
It is important to point out, however, that the reliability of the pattern would ultimately depend on a range of factors. These include market and macroeconomic conditions, timeframe, and the quality of the pattern itself.
What Is The Opposite Of A Head And Shoulders Pattern?
The inverse head and shoulders chart, as described above, is typically considered to be the opposite of the head and shoulders formation. It is a symmetrical inversion from the vertical plain rendering the pattern’s peaks as its troughs and vice versa.
Just as the head and shoulders chart is used to signal trend reversals from bullish to bearish, its inverted version showcases a shift from bearish to bullish. The neckline in both is crucial, as it points to the key point of either support or resistance.
Traders can use both patterns to enter or exit trades based on the direction of the trend reversal. In the head and shoulders chart, traders may sell or short the security once the pattern is confirmed, while in the inverse head and shoulders pattern, traders may buy or go long.
Conclusion
The head and shoulders pattern is an incredibly popular trading tool used to indicate trend reversals. It is renowned for its clear signaling, reliability, and its remarkable versatility. All these traits make it highly useful in the trader’s arsenal.
While the pattern is lauded for its compelling strengths, traders must consider its limitations such as the potential for false signals, subjectivity, and its late confirmation. Recognizing these disadvantages could save one from an overly optimistic use of the head and shoulders.
In order to achieve the most dependable results, the pattern would best be used in conjunction with other financial tools and a sound trading strategy.
As with any tool of this nature, traders must keep in mind that reliability will ultimately depend on market and macroeconomic conditions, timeframe, and the quality of the pattern itself.
FAQ
Is The Head And Shoulders A Bullish Pattern?
No, the head and shoulders formation is a bearish pattern that signals a potential trend reversal from an uptrend to a downtrend. Instead, the inverse head and shoulders can be used to identify bullish patterns.
What Are The Rules For Head And Shoulder Patterns?
The rules for the head and shoulders pattern are as follows: the pattern consists of three peaks, with the middle peak (the “head”) being higher than the other two (the “shoulders”). A breakdown below the neckline confirms the pattern and signals a potential downtrend.
How Do You Trade A Head And Shoulders Pattern?
To trade a head and shoulders pattern, you can sell or short the security once the pattern is confirmed by a breakdown below the neckline, and set a stop loss above the right shoulder.


