Every crypto exchanger, holder, or trader having any sort of bias on any coin, really should be up to date regarding the behaviour and price action on Bitcoin. As the dominance of BTC over the market is so much that almost every other altcoin moves similar to it specially in case of huge crashes or rallies. Understanding the behaviour of BTC can definitely give you an edge over the crypto market i.e. whatever coin you are dealing with. So its ideally essentially to keep up with the price of BTC from time to time.
BTC has followed our price prediction to retrace from the level
Recently after the half of July, the price was just moving bullish without any sort of proper correction. That move has induced way much early buyers, which might have benefitted to quite an extent if they understand when not to be greedy and get out.
Over this course, the price moved from $29395 to almost $52916 which is really a great percentage.
The recent sudden drop
On 7th September price did what was not expected by the huge amount of retailers. But as mentioned in our previous articles, much pressure was on a correction which will liquidate buyers who were jumping along with the flow.
Within 1 hour the price crashed from $53152.85 to $42870.02. with this fall of currencies, $2.65 billion of traders’ equity was liquidity.
This is the reason to avoid when the price is high and is taught to purchase at low. Price hadn’t been doing any sort of correction which to some extent happened during that move and many traders jumped in lower which pushed the price back from $42870 to $46888.60 within the hour of the crash.
Now talking about the recent price action and behaviour of price in recent days,
The price can be considered in a Wyckoff distribution schematic and is creating engineered support and resistance within this consolidation inducing both buyers and sellers. That 7 September candle can be considered as liquidity grabbing candle taking out both buyers and sellers to some extent but the price didn’t unfolded in any direction so still its in the consolidation phase.
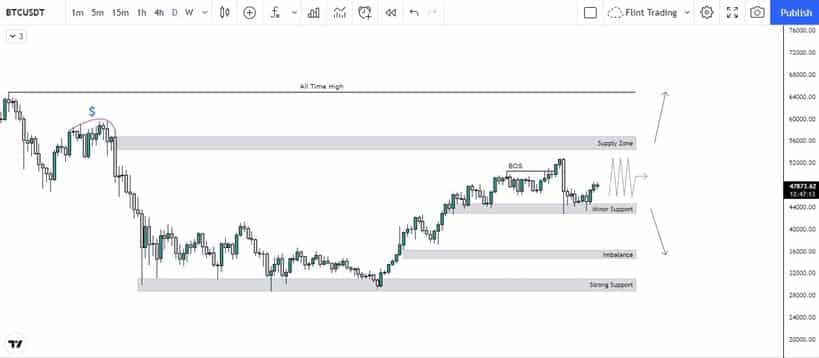
The direction of the price is really not clear to much extent, but a minor support and supply zone is resting to the downside and upside respectively. Both zones can be considered as the recent range from where a possible direction can be obtained. If the supply zone doesn’t hold and the price doesn’t show structural shifts, the price is likely to tap around all time high and will see how price delivers within that for further direction. Talking about this minor support, in case if this doesn’t hold, and the price doesn’t shows structural shifts, the price is very likely to tap in below hidden gaps aka imbalance, and fill those to continue. Now the short scenario will actually be healthy for the market as the correction wave will be completed giving fuel to the market to pump up more, but lets just stay with what the market shows.